SHERIDAN, WYOMING – Feb. 10, 2025 – This month's CoStar Commercial Repeat Sale Indices (CCRSI) offers a look at commercial real estate pricing trends through December 2024. Based on 1,710 repeat sale pairs in December 2024 and 317,677 repeat sales since 1996, the CCRSI provides a measure of commercial real estate repeat sales activity.
CCRSI National Results Highlights
U.S. COMPOSITE PRICE INDICES SLID IN DECEMBER 2024. The value-weighted U.S. Composite Index, influenced by high-value trades in core markets, dropped for the first time in five months to 245, a decline of 1.3% over the prior month. The index was down 3.1% in the 12 months ending December 2024 and 18.4% below the July 2022 all-time high. The equal-weighted U.S. composite index, reflecting lower-priced property sales in secondary and tertiary markets, sank 1.4% to 317 in December 2024. However, the index increased 2.8% in the 12 months ending December 2024 and was 0.7% above the most recent high in September 2023. Despite the recent change, "the year-over-year picture remains intact as the equal-weighted price measure stays positive, and value-weighted price declines have decelerated from the pace of losses seen in the third quarter of 2024."
EQUAL-WEIGHTED PRICES DETERIORATED IN DECEMBER 2024. Equal-weighted pricing ended 2024 with value losses at both the high and low ends of deal sizes. The investment grade sub-index, influenced by higher-value assets, plunged 1.5% in December 2024. The index climbed 5.1% over the 12 months ending December 2024 and was 16.5% below the June 2022 all-time high. The general commercial sub-index, influenced by smaller, lower-priced assets, lost 1.4% of value in December 2024 over the prior month. This sub-index rose 2.8% over the 12 months ending December 2024.
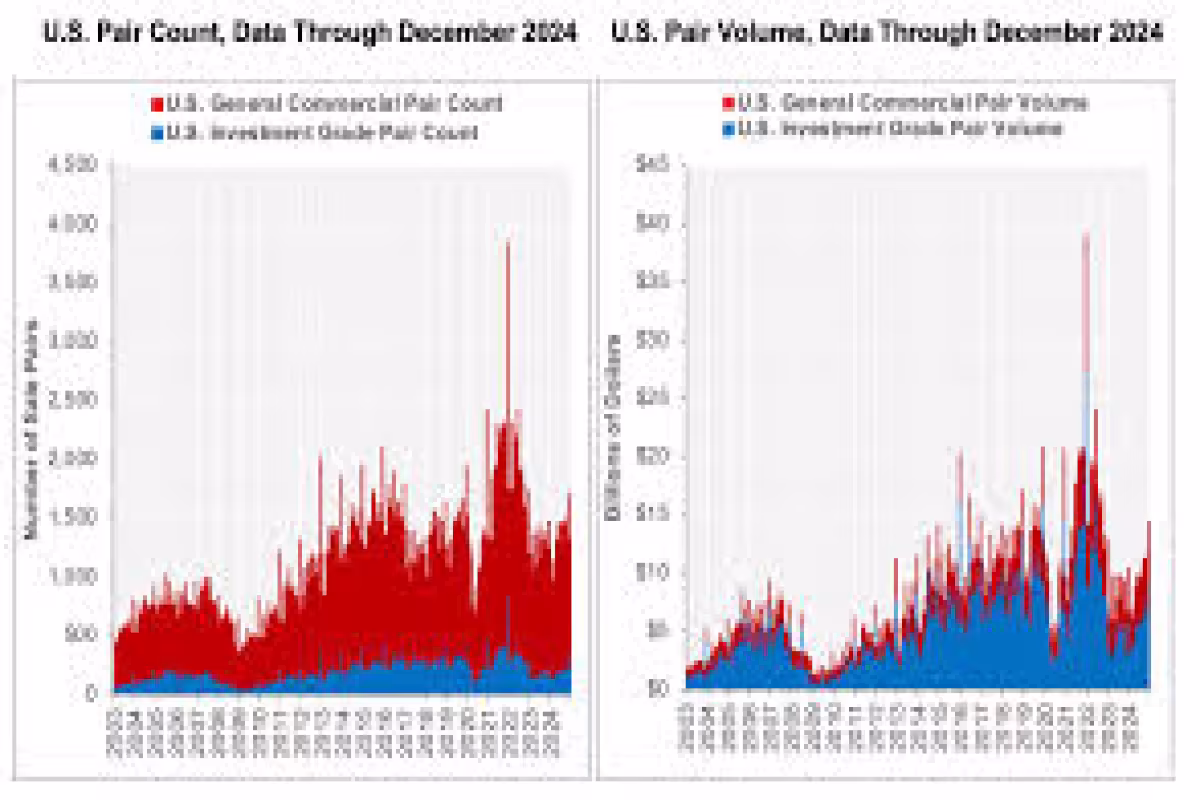
TRANSACTION VOLUME SURGED IN DECEMBER 2024. The number of transactions in December 2024 marked the sharpest December year-over-year increase in three years, with 1,710 repeat sales. "The monthly trend in year-over-year monthly sales figures has been positive since April 2024—excluding June’s head fake—following a 21-month run of declines." Sales volume in December 2024 added $3.9 billion to the month of December 2023, posting $14.4 billion in sales. Composite pair volume of $114.9 billion during the 12 months ending in December 2024 was 15.6% higher than the 12-month period that ended in December 2023. The spike in sales volume was more prominent in the investment grade segment, which leaped 25.1% over the 12 months that ended in December 2024 compared to the same period ending in December 2023. The investment grade segment accounted for 64.3% of the overall transaction volume during the last 12 months. The general commercial segment, which accounted for 35.7% of the 12-month transaction volume, grew 3.7% to $45.9 billion over the 12 months ending in December 2024.
DISTRESSED REPEAT SALES REMAINED SUBDUED IN DECEMBER 2024. Of the 1,710 repeat-sale trades in December 2024, 58, or about 3.4%, were distressed. General commercial distressed sales accounted for 32 of the distressed trades in December 2024, or 2.3% of general commercial repeat-sale trades. Twenty-six investment-grade distressed sales were recorded in December 2024, accounting for 7.7% of investment-grade repeat-sale trades.
Quarterly CCRSI Property Type Results
VALUE-WEIGHTED PRICES LED IN THE FOURTH QUARTER OF 2024. While quarterly price changes were generally flat to down in the equal-weighted indices, the value-weighted segments showed quarterly price increases. Retail and multifamily led in this area, up 2.3% and 2%, respectively, in the fourth quarter of 2024.
INDUSTRIAL PRICES WERE LITTLE CHANGED IN THE QUARTER. The equal-weighted industrial index rose 0.3% in the fourth quarter of 2024 and 2.9% in the 12 months ending December 2024. The value-weighted industrial index fared better, climbing 0.6% compared to the prior quarter and 3.4% compared to the fourth quarter of 2023. Prime industrial markets followed suit, 2.2% higher than the fourth quarter of 2023.
MULTIFAMILY QUARTERLY PRICE DECLINES WERE ARRESTED. The equal-weighted multifamily index was flat in the fourth quarter, while the year-over-year price decline slowed to 4.1% in the 12 months ending December 2024. The value-weighted multifamily index jumped 2% over the prior quarter and witnessed year-over-year value declines slow to 4.2% compared to the fourth quarter of 2023. In prime multifamily markets, the index gained 2.7% in the quarter yet lost 6.5% when paired with the fourth quarter of 2023 due to comparing against higher upside pricing volatility.
OFFICE PRICE DECLINES SLOW. The equal-weighted office index lost 1.9% in the fourth quarter of 2024 and 2.7% over the prior year, taking its overall losses to 9.7% from the all-time high in June 2022. In the value-weighted office segment, prices rose 0.2% in the fourth quarter while shedding 13.4% in value compared to the fourth quarter of 2023. From its December 2021 all-time high, value-weighted office pricing was down 44.7% as of the fourth quarter of 2024. Prime office markets saw their equal-weighted pricing fall 2.7% in the quarter while giving back 1.5% of value over the 12 months ending December 2024. Compared to its December 2022 all-time high, the prime office index shed 27.8% of its value.
LARGER RETAIL ASSETS OUTPERFORMED IN THE FOURTH QUARTER. The equal-weighted retail index fell 0.2% over the prior quarter and finished flat over the 12 months ending in December 2024. Prime retail markets also took losses in the equal-weight cohort during the fourth quarter of 2024, falling 2.6% compared to the prior quarter and 0.5% compared to the fourth quarter of 2023. On the other hand, value-weighted retail prices were up 2.3% over the prior quarter and the last 12 months.
HOSPITALITY PRICING WAS MIXED IN THE FOURTH QUARTER. The equal-weighted hospitality index climbed 1.8% in the fourth quarter but lost 1.7% of value during the 12 months ending in December 2024. Compared to its all-time high in the first quarter of 2024, equal-weighted hospitality repeat sale prices were down 3.7% through the fourth quarter of 2024.
LAND PRICES DIPPED IN THE FOURTH QUARTER. The equal-weighted land index dropped 0.8% in the fourth quarter of 2024. However, repeat-sale land prices were 9.3% higher than the fourth quarter of 2023.
Quarterly CCRSI Regional Results
PRICE CHANGES WERE MIXED WITH LARGER ASSETS OUTPERFORMING. Half of the 16 property-type regions analyzed showed price declines over the prior quarter.
SOUTH REGION. The South’s equal-weighted repeat-sale index declined 1% during the fourth quarter of 2024 while the value-weighted index grew 1% in the same period.
NORTHEAST REGION. The equal-weighted Northeast index shed 2.4% of value in the fourth quarter of 2024 and was flat, 0.3%, over the prior year.
MIDWEST REGION. The Midwest equal-weighted repeat-sale index declined 0.8%, while its value-weighted cohort was down 1.4% in the fourth quarter of 2024.